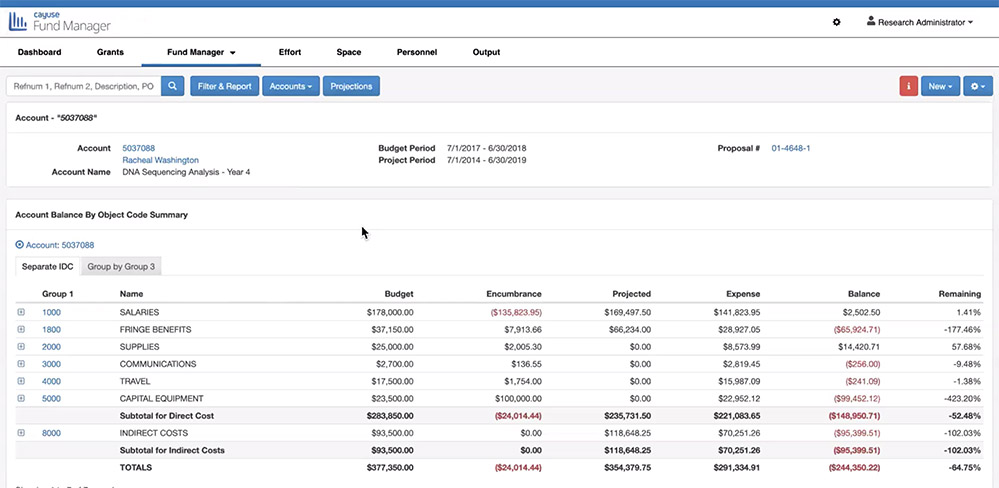
Salary coverage reports used to be created manually with spreadsheets; today, most people use an easier and more automated process: grant management software. Specifically, Cayuse Fund Manager makes it easy with a Salary and Fringe Benefit Calculator. (If you’re already using Fund Manager, check out this step-by-step guide in our help center if you’re logged in.)
Anyway, salary coverage reports allow research administrators to review the current and future salary coverage for individual and groups of scientists and associated research teams. That way, you know ahead of time if there won’t be enough money, so you can take action in advance.
A typical report format for reviewing an employee’s salary coverage presents the salary coverage information over a set period (say, 12 months) for a certain employee (let’s call her Dr. Ali Wong). A typical report is divided into three sections: a header at the top, info about active funding by month in the middle, and info about pending projects at the bottom.
Salary coverage report header
The report header often includes the following information:
- Effective date
- Name of the employee
- Employee’s annual salary as of the effective date
- Employee’s monthly salary as of the effective date
The employee’s monthly salary defines the institution’s monthly obligation for the employee and is used for comparison purposes in the lower sections of the report.
The effective date defines the starting point for the analysis.
Active funding by month
The active funding by month is presented in rows and columns in the middle section of the report. The rows present information per funding source. The bottom three rows of this section display the following:
- Total amount of the columns in the row
- Percent of the monthly obligation covered by the total amount of the columns in the row
- Amount short of the monthly obligation in the row
We will discuss the last two rows in more detail, as they are key to salary coverage analysis.
The columns in the active funding section display the following:
- Unique identifying number for each active fund or project
- Unique identifying number for projects covered by cost sharing
- Date when the amount and percent of salary covered by the funding source starts
- Date when the amount and percent of salary covered by the funding source ends
- Percent of salary covered by the funding source
- Monthly amount provided by the funding source
In most cases, 12 monthly amount columns are used. The month of the effective date is the first monthly amount column. The month of the column is displayed in the column header. Monthly columns dated between the start and end dates contain the amount of salary provided by the funding source in the first column. Monthly columns dated after the end date contain blank values and provide a visual indicator of gaps in future funding for the employee’s salary. This visual indicator allows the user of the report to quickly discern when funding is needed for an employee.
The bottom two rows of this section provide information regarding how much funding is being provided and how much is needed in the future. The % Covered row shows the percentage of the monthly obligation that is provided. When an employee’s salary is fully covered, the value in this row is 100. Additional funding is needed for any month with a value less than 100. The $ Short row shows the amount of the monthly obligation that is not met and is needed to provided complete coverage to meet an employee’s salary requirements. This number can be quite large when there are funding shortages for highly compensated employees.
Pending projects
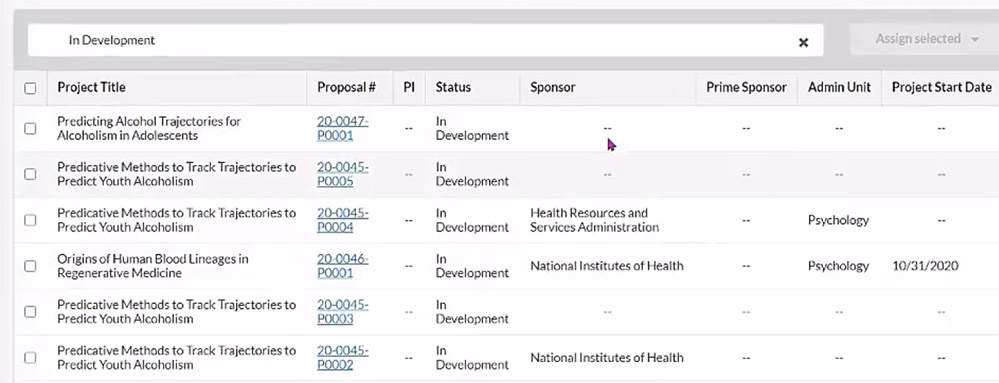
At most research organizations, alleviating funding shortages requires getting new funding through sponsored projects. And because that takes time for proposal development, submission, and receipt of funding, the need for advance notice (salary coverage monitoring) is an essential part of grant management. While there’s no guarantee that pending projects will be funded, it’s often helpful to include them in the salary coverage reports to monitor the efforts that have already been made to acquire additional funding.
Pending projects are often listed in the bottom section of a report. The layout of this section is like that of the Active Funding section except for the following:
- Unique identifying project ID is replaced with the sponsor code and a unique proposal number
- Proposed budget period start and end dates are used as the start and end dates
- Amount provided by the funding source is calculated by multiplying the committed effort on the proposal by the monthly salary
The bottom row of this section is the sum of the percent covered by Active Funding and Pending Projects.
Interpreting salary coverage reports
Reading a salary coverage report can make you realize that unless new measures are taken, there may not be funding available to fully support an investigator’s salary starting in a certain future month. Even if pending proposals are funded, there still may not be adequate funding.
The good news is that an easy-to-read salary coverage report can let you know you should take immediate action such as a renewed focus on submitting additional proposals, collaboration with other investigators, and others.
If you’re interested in seeing how easy reporting can be with Cayuse, watch this on-demand demo video to see our reporting in action!